Looker Studio Done Easy!
Getting Started
You must set up a Google Analytics account before a Looker Studio dashboard can be created.
About Looker Studio
Google Looker Studio is a visualization tool that is powered by your website Google Analytics data. With very minimal effort, Looker Studio can help you:
- visualize and analyze your website Google Analytics data reports.
- customize and present analytics data important for your agency needs.
- share with anyone in your agency or embed on SharePoint.
Here's an example of the Google Looker Report for the Digital Commons Support site.
Create a Looker Studio Dashboard
- Log into your Google Analytics account and in a new tab go to LookerStudio.com.
- Select any Template and wait to see the new report populated with your website Google Analytics data.
Looker Studio window has the selected dashboard populated with your website data, let's save it and start editing:
- click on the blue Edit and share button on the top right of the screen,
click on the Add to Report pop-up window.

Give your dashboard a clear and meaningful name and title:
- on the very top left of the screen beside the Data Studio logo with the three blue lines, instead of the Copy of [New] Google Analytics Audience Overview
on the top of the report update report title, if needed.

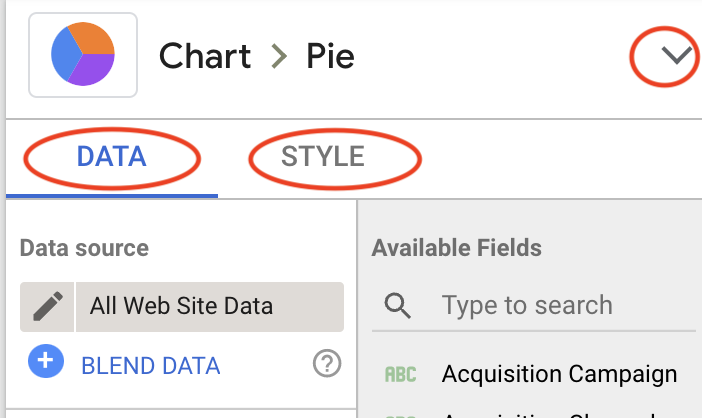
Every chart/tile on the dashboard could be changed and styled based on your needs and taste. When chart is selected a blue border appears around it, at the same time two menus appear on the right hand side: Data and Style. All changes made on the dashboard are saved in real time, but there is always an Undo button.

Need Help? Open a Service Now Website Analytics support ticket with the Digital Commons team.


