Google Analytics
Get Started

Google tracks and collects a broad range of data about your public-facing website and your site visitors' behavior. Free Google Analytics data reports have information about your website starting from the day that your site was launched on the Digital Commons platform. You can use this information to help drive your decisions on everything from content creation to structuring your web design.
Set Up Google Analytics
Your first step is to set up an Analytics account, unless you already have one. Skip to creating a property unless you want to create a separate account for this website and/or app. For example, you might want to create another account if this website and/or app belong(s) to a separate business. Log into your agency Google Analytics account with your agency @gmail and password. We recommend creating a shared @gmail account for your web team to avoid lapse of access to Google Analytics due to staff changes.
Need help with access to Google Analytics? Open a Service Now Website Analytics support ticket with the Digital Commons team.
- Log into your agency Google Analytics account If this is your first time using Google Analytics, click Start Measuring. If you already have an account set up, go to step 2.
In Admin, click Create, then select Account.
Note: The previous link opens to the last Analytics property you accessed. You can change the property using the property selector. You must be a Viewer or above at the account level to create an Analytics account.- Provide an account name. Configure the data-sharing settings to control which data you share with Google.
- Click Next to add the first property to the account.
Up-to-date information from google about setting up analytics
You need the Editor role to add properties to a Google Analytics account. If you created this account, you automatically have the Editor role.
To create a property:
- Are you continuing from "Create an Analytics account", above? If so, skip to step 2. Otherwise, in Admin, click Create, then select Property.
- Enter a name for the property (e.g. "My Business, Inc website") and select the reporting time zone and currency. If a visitor comes to your website on a Tuesday in their time zone, but it's Monday in your time zone, the visit is recorded as having occurred on Monday.
- If you choose a time zone that honors Daylight Savings Time, Analytics automatically adjusts for time changes. Use Greenwich Mean Time if you don't want to adjust for Daylight Savings Time.
- Changing the time zone only affects data going forward. If you change the time zone for an existing property, you may see a flat spot or a spike in your data, caused by the time shift forwards or backwards, respectively. Report data may refer to the old time zone for a short period after you update your settings, until Analytics servers have processed the change.
- We recommend that you change the time zone for a property no more than once per day so Analytics can process the change.
- Click Next. Select your industry category and business size.
- Click Next. Select how you intend to use Google Analytics.
- Google Analytics tailors the set of default reports based on the information you provide about how you intend to use Analytics. For example, if you choose "Generate more leads," you will see a collection of reports to help you measure lead generation. Learn more about the business objectives reports collection.
- Click Create and (if you are setting up a new account) accept the Analytics Terms of Service and the Data Processing Amendment.
- Continue to Add a data stream to start collecting data.
- Are you continuing from "Create a property", above? If so, skip to step 2. Otherwise,
In Admin, under Data collection and modification, click Data Streams.
Note: The previous link opens to the last Analytics property you accessed. You can change the property using the property selector. You must be an Editor or above at the property level to add a data stream.- Click Add stream.
- Click iOS app, Android app, or Web.
- For Web
- Enter the URL of your primary website, e.g., "example.com", and a Stream name, e.g. "Example, Inc. (web stream)".
- You have the option to enable or disable enhanced measurement. Enhanced measurement automatically collects page views and other events. Once the data stream has been created, you can always go back and individually disable the enhanced measurement events you don’t want to collect. So, we recommend that you enable enhanced measurement now.
- Click Create stream.
Google collects many data metrics based on the pageviews - each time someone visits one of your pages, information collected about device and browser used, and number of pages visited. A visitor’s time on the website is called a session, it begins with a page view hit when the user first visits the website, and it continues until they ultimately leave the site. A visitor could trigger an event when they do something on your site, for example, downloading a document or playing a video. Here are some key definitions you’ll need:
- Pageviews - A view, or load request, of a specific page. The total number of times a specific page has been viewed during a specific date range. This includes the same person looking at your page 5 times in one session, or 5 different people looking at your page one time. This will tell you if the same people are coming back to your site or are they one and done.
- Unique Pageviews - These are pageviews made by unique, or individual, visitors in a specific date range. This number represents those 5 different people looking at your page in one session (5 unique pageviews), rather than the one person refreshing or reloading their screen (one unique page view). This can show how many people are visiting your site.
- Session - A session starts when a user first arrives on a website and ends once the website is exited, after 30 minutes of inactivity, or if bot activity is detected. Note that if the website is exited but revisited within 30 minutes, a new session is not started.
- Average Time on Page - The average time visitors are staying on that page. This may not be something you need to be overly concerned about, but it is a good indicator if people are sticking around (let’s say on a blog or press release page, you’d like this number to be higher than normal) or if people are finding what they need quickly (on an FAQ or Forms page where visitors are finding what they need and leaving, you’d like this number to be low).
- Bounce Rate - This percentage shows the rate of single-page visits to your website. If someone visits a page of your website, and then exits that same page (leaving your website completely), that counts towards your bounce rate.
- Exit Rate - Not to be confused with the Bounce Rate, this rate is the percentage of site exits from your website, regardless of how many pages a user has viewed. It’s calculated by dividing exits into total pageviews, and therefore is never 100%.
- Total Sessions - The number of times users visited your website.
- Total Users - Encompasses all unique users who have interacted with your website or app within a specific timeframe, including both new and returning users.
- Visits - The number of individual sessions started by all visitors to your website, no matter how many sessions they start. If a user is inactive on your site for 30 minutes or more, any future activity is attributed to a new session. Users that leave your site and return within 30 minutes are counted as part of the original session.
- Search Term - The term a user entered when using the onsite search engine.
Learn Google Analytics
The information on this page will get you started, but Google Analytics tools and monitoring are changing constantly. Stay up to date with training offered by Google Skillshop.
Get started with Google Analytics
Set up Data Collection
Many Content Management Systems (CMS) have native integrations with Google Analytics 4, including Digital Commons. If you're using a CMS listed below, follow the instructions to find your Google tag ID and paste it into the Google Analytics field that your CMS provides.
If you are using a CMS or website builder that doesn't provide a field to enter your Google tag ID, you'll need to paste your Google tag into your website using your CMS's custom HTML feature. Skip the steps below and go to the next Tab/Accordion for instructions.
To find your Google tag ("G-") ID:
In Admin, under Data collection and modification, click Data streams.
Note: The previous link opens to the last Analytics property you accessed. You can change the property using the property selector. You must be an Editor or above at the property level to create.- Click the data stream for which you need the ID.
- Under Stream Details, copy the Measurement ID (starts with "G-" or "AW-")
- For Digital Commons sites - just provide us with the Measurement ID and we'll add it for you!
Enter your Google tag ID into the field that your CMS provides:
- Blogger instructions
- Drupal instructions
- Duda instructions
- GoDaddy instructions
- Google Sites instructions
- HubSpot instructions
- Magento instructions
- MonsterInsights plugin (WordPress) instructions
- One.com instructions
- Shopify instructions
- Site Kit (WordPress plugin) instructions
- Squarespace instructions
- Typo3 instructions
- Wix instructions
- WooCommerce instructions
If you are using a CMS or website builder that doesn't provide a field to enter your Google tag ID, you'll need to paste your Google tag into your website using your CMS's custom HTML feature.
In Admin, under Data collection and modification, click Data streams.
Note: The previous link opens to the last Analytics property you accessed. You can change the property using the property selector. You must be an Editor or above at the property level to create.- Click Web.
- Click the data stream for your website.
- Under Google tag, click View tag instructions.
- On the Installation instructions page, select Install manually:
- On the screen, you’ll see the JavaScript snippet for your account's Google tag. Your Google tag is the entire section of code that appears, beginning with:
<!-- Google tag (gtag.js) -->
and ending with</script>
- On the screen, you’ll see the JavaScript snippet for your account's Google tag. Your Google tag is the entire section of code that appears, beginning with:
Paste your Google tag to your website using your CMS's custom HTML feature. Follow your CMS's instructions on how to do this below:
- Cart.com: Contact Cart.com support for instructions.
- PrestaShop: Contact PrestaShop support for instructions.
- Salesforce (Demandware): Contact Salesforce support for instructions.
- VTEX: Contact VTEX support for instructions.
- Weebly instructions
Data collection may take up to 30 minutes to begin. You can then use the Realtime report to verify that you're receiving data.
You need access to the HTML for your web pages. Ask your web developer to perform these steps if you're unable to complete the steps yourself.
In Admin, under Data collection and modification, click Data streams.
Note: The previous link opens to the last Analytics property you accessed. You can change the property using the property selector. You must be an Editor or above at the property level to create.- Click Web.
- Click the data stream for your website.
- Under Google tag, click View tag instructions.
- On the Installation instructions page, select Install manually:
- On the screen, you’ll see the JavaScript snippet for your account's Google tag. Your Google tag is the entire section of code that appears, beginning with:
<!-- Google tag (gtag.js) -->
and ending with</script>
- On the screen, you’ll see the JavaScript snippet for your account's Google tag. Your Google tag is the entire section of code that appears, beginning with:
Paste your Google tag immediately after the <head> on each page of your website.
Data collection may take up to 30 minutes to begin. You can then use the Realtime report to verify that you're receiving data.
For basic data collection, follow the Google Tag Manager help center instructions to add the Google Analytics: GA4 Configuration tag.
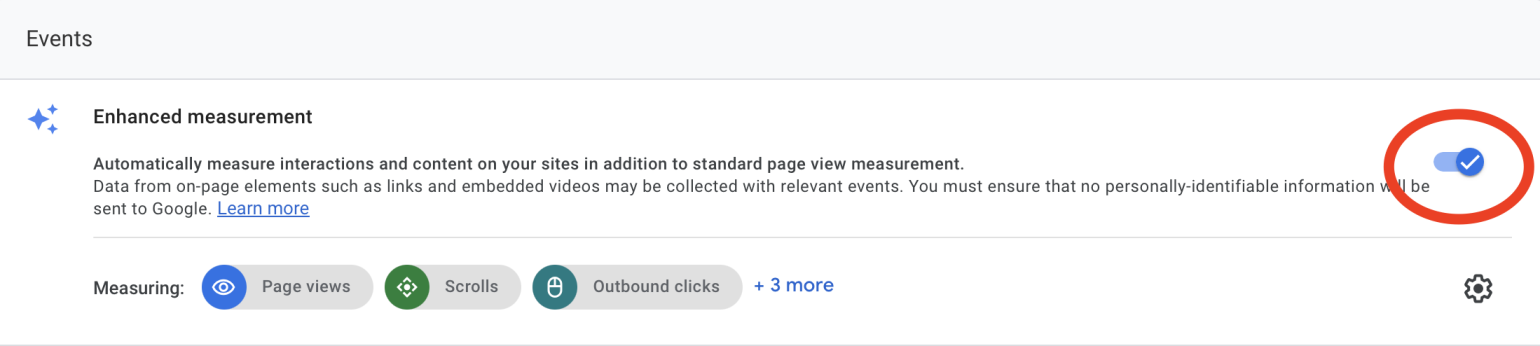
Turn on Enhanced Measurements
To take full advantage of GA4's capabilities, your accounts need to have Enhanced Measurements turned on. This allows for features like automatic event detection for actions like page views, scrolls, video views, and link clicks to be monitored.
To review your Enhanced Measurements settings:
In the "Property" column, select "Data Streams > Web.

Slide the Enhanced measurement switch to "On." (You can edit individual event options with the gear icon found just below.)
If your website has a search feature, you should be tracking it.
Site search tracking can provide key insights into what people are looking for on your site and how well it's meeting those needs. Internal site search data can apprise you of many aspects of your strategy and especially for your SEO efforts.
To set up site search tracking in GA4:
- Select "Data Streams" under the "Property" column within the Admin section.
- You will now see all available streams.
- Select the stream for which you want to set up search site tracking.
- Under "Enhanced Measurement" select the gear icon.
- Ensure that the Site Search option is enabled (it may be hidden so be sure to expand the list).
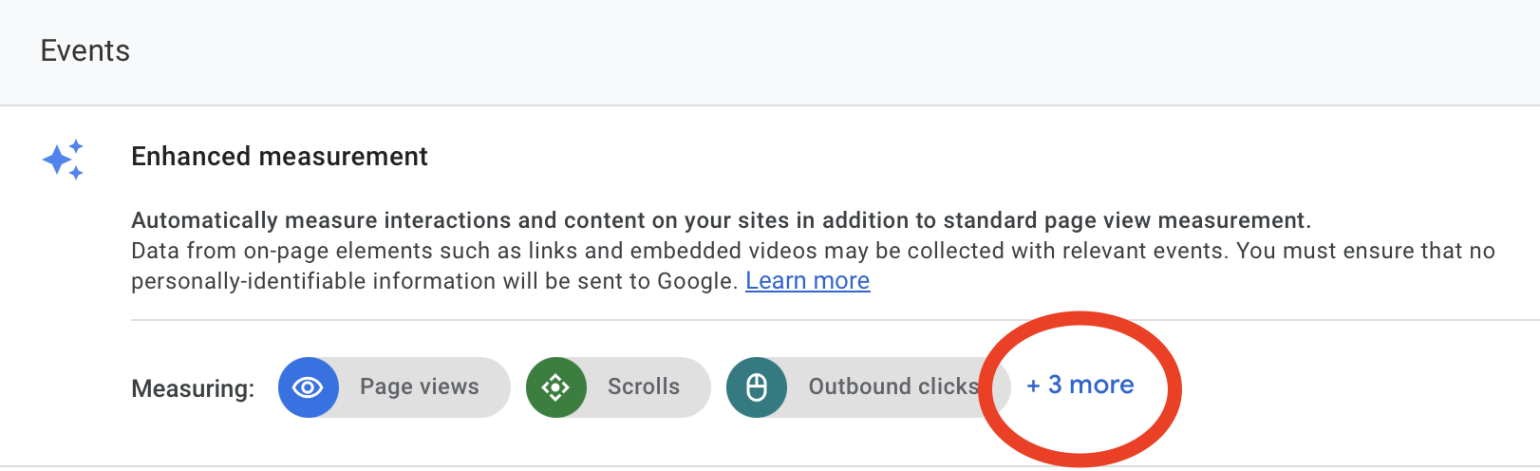
Note: If your site search parameters aren't among those automatically tracked by Google, there will be a few additional steps to follow. Read more about that here. (You might also need to set up a custom dimension to track your search terms.)
The integration with Search Console lets you analyze organic search related to your site. You can, for example, see where your site is ranked in search results, which queries lead to clicks, and how those clicks translate to user behavior, like which landing pages engage users more and how many users interact with key events.
In Analytics, you create the integration by linking a Google Analytics 4 web data stream and a Search Console website property. You can also create the link in Search Console.